Learn From Every Second
Why It Matters
If something drifts, stalls, or degrades, the answer is almost never in the present moment.
It’s in the past.
But most control systems treat history as an afterthought:
- Fixed-resolution logs
- Heavy charting
- Export-to-Excel workflows
- Fragmented datasets
When learning requires friction, it rarely happens.
Logging should not be a burden.
It should be power.
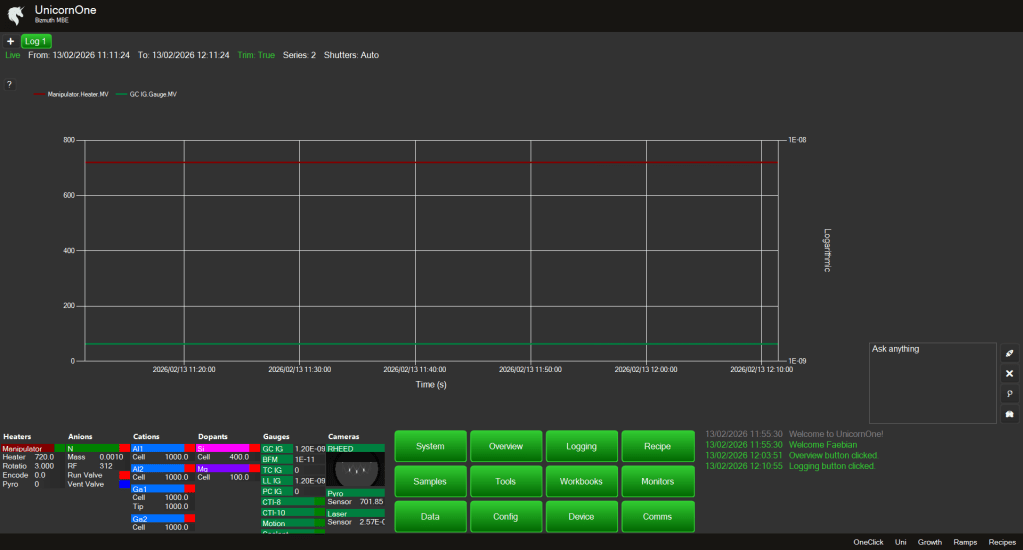
Flexible Charting — Without Limits
Open as many charts as you need.
Each chart can display:
- One signal
- Or twenty
- Overlaid for correlation
Temperature, pressure, metrology signals, shutter transitions — all in one view if needed.
For clarity:
- Toggle between linear (Y1) and log (Y2) scale with a single click
- Zoom
- Pan
- Inspect values via hover tooltips
No reloading.
No waiting.
Dynamic Resolution
Data is not stored as static chart snapshots.
It is reconstructed in real time from immutable SQL databases.
And it adapts.
Zoom out to 7 days:
- Data appears in 5-minute buckets.
Zoom into 30 seconds:
- Resolution shifts to 1-second buckets.
The depth and resolution adjust dynamically.
You always see the right level of detail for the time window you care about.
Without overwhelming the UI.
Without overloading the system.
Performance by Design
The UI never gets heavy.
Data is:
- Structured
- Compressed
- Reconstructed on demand
Large time spans remain responsive.
Short windows remain precise.
You do not choose between speed and fidelity.
You get both.
Visual Continuity
Logging shares the same visual language as Overview:
- Same color coordination
- Same signal naming
- Same component grouping
A heater looks like a heater.
A pressure signal looks like a pressure signal.
Metrology signals integrate naturally.
Familiarity reduces cognitive load — even in deep analysis.
Save What Matters
You can:
- Save default chart layouts
- Store custom signal overlays
- Reopen your preferred analysis views automatically
Your insight workflow becomes persistent.
Not disposable.
The Philosophy
Knowledge comes from history.
Correlation reveals causation.
Patterns emerge over time.
Drift becomes visible.
Operator intuition becomes structured evidence.
Logging in UnicornOne is not a side feature.
It is the foundation for:
- Process optimization
- Failure analysis
- Predictive modeling
- Future AI agents
If time has shown anything, it is this:
We only improve what we can observe.
